Economics Challenge Series 2024 – Challenge 7: Tax Game
Hi Everyone,
Welcome to the Economics Challenge Series for 2024. For July and August, I am running an economics challenge series. The series consists of seven challenges. All the challenges will commence in July and early August. I will publish and announce the results in August.
Six of the seven challenges from last year's Challenge Series return. The Tax Game from 2022 is replacing the business version of the Buying and Selling Game. Below is the list of challenges.
- Challenge 1: Ice Cream Game
- Challenge 2: Game Theory Game
- Challenge 3: Pick-a-Door
- Challenge 4: Complement vs. Substitute
- Challenge 5: The Buying and Selling Game
- Challenge 6: Even-to-Win
- Challenge 7: Tax Game
Each challenge could reward winners with as much as 60 Hive Power. The value of the prize will depend on the level of participation. For each new participant, the prize will increase by 5 Hive Power. This will continue until 60 Hive Power is reached (12 participants). The first 12 participants will also receive a 50% upvote from this account.
In addition to the prize money, the top few participants will be given points. These points will be used to determine the overall challenge series winner. This winner may receive as much as 80 Hive Power. The value of the prize will equal the sum of the number of participants across all challenges. This will continue until 80 Hive Power is reached.
For more information on the challenge series and the upcoming challenges, I recommend that you read my post from last year. This year’s Challenge Series is run the same way as last year’s.
Welcome to Challenge 7: Tax Game
How to Play?
Taxation is a very divisive topic. Most people do not like paying taxes. Some people believe it is a necessary evil, as many initiatives cannot or should not be funded by the private sector of the economy. Others believe that Governments are inefficient and incompetent and should not be trusted with large sums of money. Some people would even claim that Governments are corrupt and focused on serving their own needs with very little or no regard for the people they claim to represent. This challenge requires participants to put their beliefs regarding taxes to one side. Participants need to make decisions regarding tax rates based on what they believe will happen to income and welfare based on the parameters outlined in this challenge.
For this challenge, participants are required to set the tax rate for a very small country. Tax has been simplified to just a percentage of overall income (i.e., no distinction between different taxes such as income tax, corporate tax, GST, etc.). The current tax rate and national income are provided in the question. The participants are required to set the tax rate yearly for the next 3 years (i.e., rate in Year 1, Year 2, and Year 3). They can choose any tax rate they please (anywhere between 0% and 100%). Changing the tax rate will have both benefits and costs. For example, lowering the tax rate will raise income, but if tax revenue falls as a result of a lower tax rate, there could be a social cost of reduced funding of services provided by the Government. However, social costs will be reduced in the following year, as it is assumed the market will partially adjust to lower or higher Government spending.
The extent of the increase in income and changes in social costs will be determined in a Microsoft Excel model. The participants will be provided with a range of possible values for parameters for key determinants of income and social cost.
All entries must be made in the comments section of this post.
Each account is only permitted one entry.
Objectives of the Game
Participants should aim to maximise the sum of national income for the 3 years plus or minus changes in social costs during that same period. The participant who achieves this will win the challenge.
Game Assumptions
- Reducing tax rates encourages economic activity, and increasing tax rates discourages economic activity. The extent of the change in economic activity is determined through an algorithm (see formulae section).
- Reducing tax comes with an immediate cost. The extent of this cost is determined by the welfare penalty parameter outlined in the formulae section.
- The cost of reducing taxes is reduced over time as the economy adjusts to reduced Government expenditure. The extent of this adjustment is determined by the welfare recovery parameter (see formulae section).
- Increasing taxes does not produce immediate additional benefits. The welfare recovery parameter is also used to determine the lag in receiving these benefits. The absence of these benefits is presented in the results as a social cost.
- Participants have no control over how tax revenue is used.
- Population is assumed to remain unchanged over the 3 year analysis period.
- Income, tax revenue, and welfare are assumed to be unaffected by anything beyond the information described in this challenge.
What Information is Provided?
- Current National Income
- Current tax rate expressed as a percentage
- Current total tax revenue
- Range for sensitivity of income to tax rate
- Range for welfare recovery from tax shock
- Range for welfare penalty parameter from tax shock
Formulae
Below are the formulae used to calculate income, tax revenue, and social cost for changes in tax rates.
New Income = Existing Income × (1-New Tax RateX)/(1 -Existing Tax RateX)
New Tax Revenue = New Income × New Tax Rate
Benefit from Increased Tax Revenue = Increase in Tax Revenue/2
Welfare Penalty for Tax Revenue Reduction (YR1) =(2 + (ETR -TR(Yr1))/ETR)Y/2^Y
Welfare Penalty for Tax Revenue Reduction (YR2) =(2 + ( TR(Yr1) - TR(Yr2))/ TR(Yr1))Y/2^Y
Welfare Penalty for Tax Revenue Reduction (YR3) =(2 + ( TR(Yr2) - TR(Yr3))/ TR(Yr2))Y/2^Y
Social Cost (Yr1) = (ETR-TR(Yr1)) × WP(YR1)
Social Cost (Yr2) = 1/Z(ETR-TR(Yr1) × WP(YR1) + (TR(Yr1)-TR(Yr2)) × WP(YR2)
Social Cost (Yr3) = 1/Z2(ETR-TR(Yr1)) × WP(YR1) + 1/Z(TR(Yr1)-TR(Yr2)) × WP(YR2) + (TR(Yr2)-TR(Yr3)) × WP(YR3)
Net Outcome = New Income – Social Cost
Total = Net Outcome(YR1) + Net Outcome(YR2) + Net Outcome(YR3)
Where:
X = Parameter to determine sensitivity of income to tax rate. Value ranges between 1 and 2 (uniform distribution). Higher values reduces sensitivity of income at lower tax rates
Y = Parameter to determine welfare penalty from reduced Government spending (Note: parameter excluded from tax rate increases). Value ranges between 3 and 5 (uniform distribution). Higher values increase the penalty
Z = Parameter for welfare recovery from changes in tax rates. Reduces impact based on the economy’s ability to adapt. Value ranges between 1 and 1.5 (uniform distribution). Higher values increase the rate of recovery
ETR = Existing Tax Revenue
TR(YR) = Tax Revenue in the respective year
WP(YR) = Welfare Penalty for tax revenue reduction in respective year
To gain a better understanding of the impact a changing tax rate could have on income and tax revenue, see Figures 1, 2, 3 and 4.
Figure 1: Income at different Tax Rates when Parameter X = 2 (Maximum)
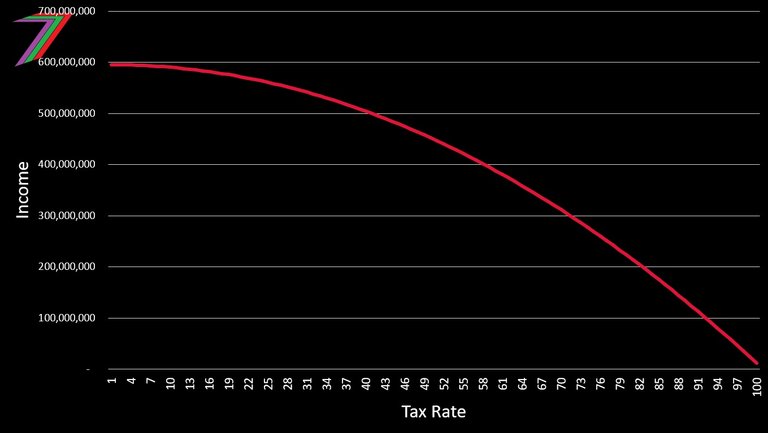
Figure 2: Income at Different Tax Rates When Parameter X = 1 (Minimum)
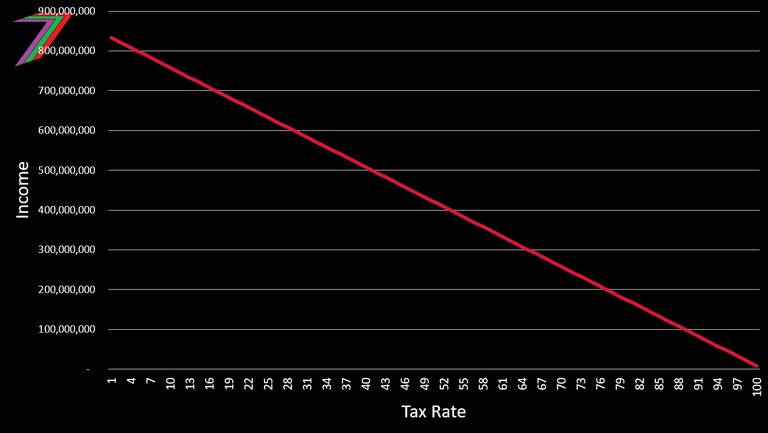
Figure 3: Relationship between Tax Revenue and Tax Rate When Parameter X = 2 (Maximum)
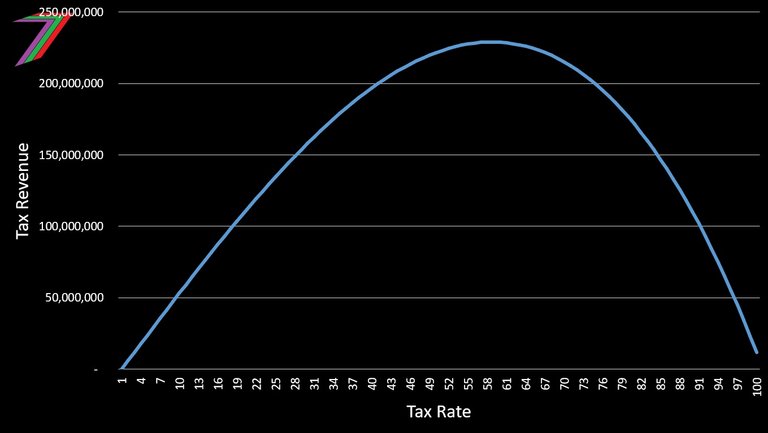
Figure 4: Relationship between Tax Revenue and Tax Rate When Parameter X = 1 (Minimum)
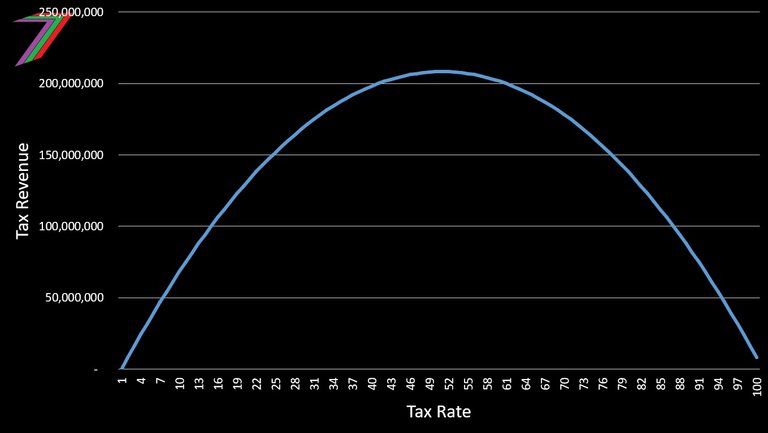
Note: Values on the y-axis are based on values provided later in the question.
To gain a better understanding of the impact the welfare penalty has on social costs, see Figure 5.
Figure 5: The Social Cost of Reducing Tax Revenue When Parameter Y = 3 and 5
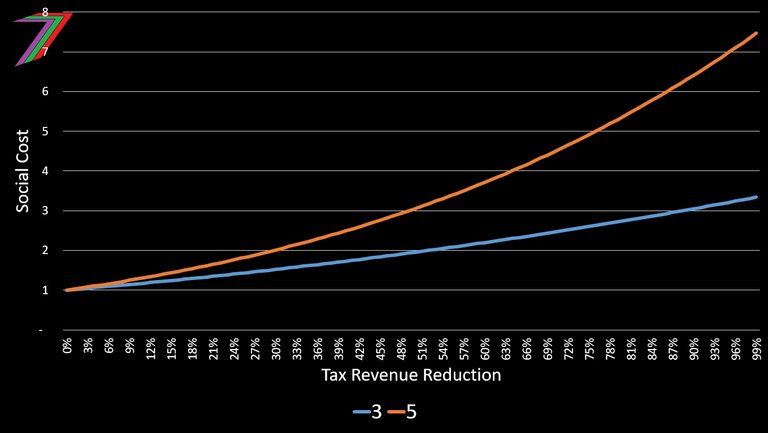
The welfare penalty increases as tax revenue falls. The parameter determines the extent of this increase.
How are the Results of the Game Determined?
A Microsoft Excel model is used to determine the values of national incomes and social costs for each year. The model generates the values for the parameters for income sensitivity to tax rate, welfare penalty, and welfare recovery. The results post will contain a video of the generation of the values. The winner will be announced in both the video and written post.
Challenge Prizes
The total prize for this challenge could reach as high as 60 Hive Power. The number of participants determines the value of the prize. For every entry, the prize is increased by 5 Hive Power until a value of 60 Hive Power is reached. The winner will receive 2/3 of the prize and second place will receive 1/3. The first 12 entries will be given upvotes. The winner of this challenge will be given 40 points, second place 20 points, and third place 10 points. These points will be tallied at the end of the challenge series to determine the overall winner.
Let the Challenge Begin!
Participants are required to enter tax rates for Years 1, 2, and 3. Information regarding the existing income, the Government’s current tax rate, and tax revenue are shown in Table 1.
Table 1: Existing Income, Tax Rate, and Tax Revenue
| Item | Value |
|---|---|
| Tax Rate | 45% |
| Income | 467,278,581 |
| Tax Revenue | 210,275,361 |
| Social Cost | 0 |
| Net Outcome | 467,278,581 |
See the formulae section for the algorithms used to determine income, tax revenue, social costs, and net outcomes. The formulae section also contains the ranges for key parameters in these algorithms.
Entry Format
For this challenge, I expect to see entries made in the following format:
Tax Rate Year 1:
Tax Rate Year 2:
Tax Rate Year 3:
Example of Entry
Tax Rate Year 1: 35%
Tax Rate Year 2: 25%
Tax Rate Year 3: 15%
The closing date and time for this challenge is 6PM coordinated universal time (UTC) 08/08/2024. Responses after this time will not be accepted. The results of the challenge will be announced in a separate post.
I hope everyone has fun and enjoys this final challenge. If you have any questions, feel free to ask in the comments section. The results for Challenge 1 will be posted soon.
My New Book, Sapien Loop

I have published an ebook on Amazon; it is titled ‘Sapien Loop: End of an Era’. The book is fiction. I do not normally write fiction. However, I felt it was appropriate considering what is happening in the world today. Freedom is the most important thing we have, but we are gradually losing it. I have covered this in many of my posts.
In the story, most citizens do not understand the concept of freedom because they have never really experienced it. In essence, the story is about an alien world that might represent our not-so-distant future. There are many other elements to the story that are an abstract and exaggerated version of our reality. I believe this book to be an important read, and I believe it has the potential to change the way you think.
Brief Summary of Sapien Lopp
This story is based on the fictional planet Sapia and its sole country, Sapey. Sapey is portrayed as a form of utopia for all its citizens. No poverty. No war. Almost no crime. Opportunities for all.
This was enough for most citizens, but not all. In one of the small regions, some of the citizens had become discontent. They felt something important was missing in their lives. Their discontent did not go unnoticed. Some of the Sapey elite wanted to weaponise this discontent to gain more power. This created more chaos than they anticipated. This led to further widespread social unrest.
On top of the chaos, ambition and greed provoked another enemy. This enemy was on a mission to settle both new and old scores.
If you want to buy a copy of the book, below are links to the relevant Amazon websites for each country it is available in. The book is priced at approximately US$5.08.
- Amazon USA
- Amazon UK
- Amazon Germany
- Amazon France
- Amazon Spain
- Amazon Italy
- Amazon Netherlands
- Amazon Japan
- Amazon Brazil
- Amazon Canada
- Amazon Mexico
- Amazon Australia
- Amazon India
I am also running monthly contests where participants are required to answer questions based on the book. The prize is 30 Hive Power plus upvotes for the first twelve entries. You can recover the cost of the book with just one win.
Hive: Future of Social Media

Spectrumecons on the Hive Blockchain

Tax Rate Year 1: 40%
Tax Rate Year 2: 35%
Tax Rate Year 3: 30%
@tipu curate
Upvoted 👌 (Mana: 65/75) Liquid rewards.
Tax Rate Year 1: 25%
Tax Rate Year 2: 25%
Tax Rate Year 3: 25%
Tax Rate Year 1: 20%
Tax Rate Year 2: 20%
Tax Rate Year 3: 30%
Tax Rate Year 1: 30%
Tax Rate Year 2: 25%
Tax Rate Year 3: 20%
Tax Rate Year 1: 42%
Tax Rate Year 2: 36%
Tax Rate Year 3: 27%
Tax Rate Year 1: 20%
Tax Rate Year 2: 30%
Tax Rate Year 3: 35%
Tax Rate Year 1: 26%
Tax Rate Year 2: 23%
Tax Rate Year 3: 20%
Tax Rate Year 1: 25%
Tax Rate Year 2: 22%
Tax Rate Year 3: 18%
Tax Rate Year 1: 20%
Tax Rate Year 2: 26%
Tax Rate Year 3: 35%
Tax Rate Year 1: 40%
Tax Rate Year 2: 20%
Tax Rate Year 3: 30%
Tax Rate Year 1: 35%
Tax Rate Year 2: 20%
Tax Rate Year 3: 40%
Tax Rate Year 1: 30%
Tax Rate Year 2: 33%
Tax Rate Year 3: 35%