Tax Game Contest Results
Hi Everyone,
Welcome to the Tax Game Contest results post. This is the seventh economics contest for 2023. This post contains a video of an Excel Model. This Excel Model determines the winner of the contest by generating income, tax revenue, and social costs and benefits from the changes participants make to tax rates.
Winner determined in this video
What is the Tax Game Contest?
For this contest, participants are required to set the tax rate for a very small country. Tax has been simplified to just a percentage of overall income (i.e. no distinction between different taxes such as income tax, corporate tax, GST, etc.). The current tax rate and national income are provided in the question. The participants are required to set the tax rate yearly for the next 3 years (i.e. rate in Year 1, Year 2, and Year 3). They can choose any tax rate they please (anywhere between 0% and 100%). Changing the tax rate will have both benefits and costs. For example, lowering the tax rate will raise income but, if tax revenue falls because of a lower tax rate, there could be a social cost of reduced funding of services provided by the Government. However, social costs will be reduced in the following year as it is assumed the market will partially adjust to lower or higher Government spending.
Responses to the contest are made in the comments section of the contest post. The account with the winning entry will receive 30 Hive Power.
The format of the required entry is explained in detail in the challenge itself.
For a more detailed explanation, you can access the contest post using the following link.
Results of the Tax Game
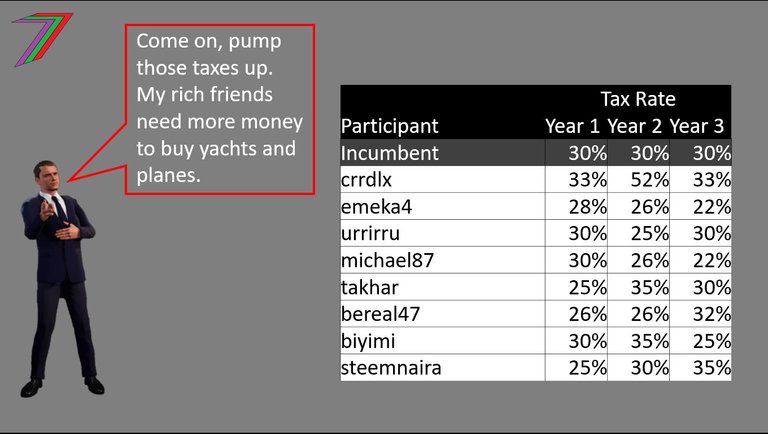
Table 1 contains the participants and the tax rates they proposed for the contest.
Table 1: Participants and their proposed tax rates
The model generated three key parameters. They are for determining income’s responsiveness to the tax rate, the social cost of reducing funding for goods and services previously funded by Government (tax revenue reduction only), and the extent the market can compensate from reduced Government spending. Table 2 contains the parameters generated in the model.
Table 2: Model Generated Parameter Values
| Parameter | Value |
|---|---|
| Income Sensitivity | 1.05 |
| Welfare Recovery | 1.22 |
| Welfare Penalty | 5.13 |
Note: these parameters have very little meaning without the formulae they are applied to. Refer back to the original question for more context.
The parameters were applied to the formulae stated in the question to determine income and social costs for each participant. Tables 3, 4, and 5 contain the income and social costs for each participant for each year. Table 5 also contains the totals and the winner of the contest.
Table 3: Income and Social Costs Year 1
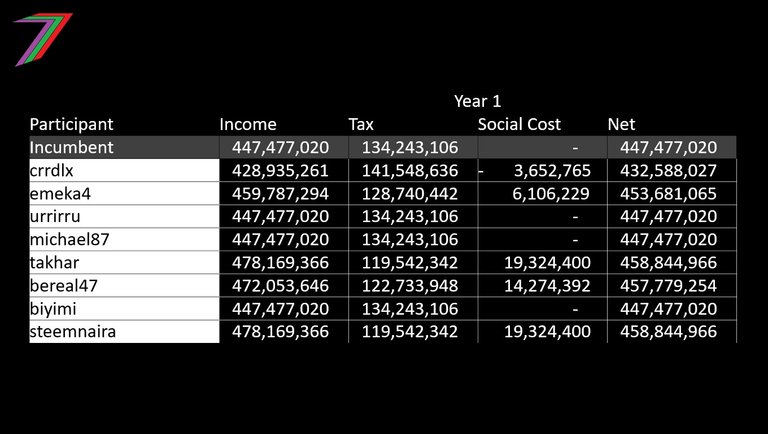
Table 4: Income and Social Costs Year 2
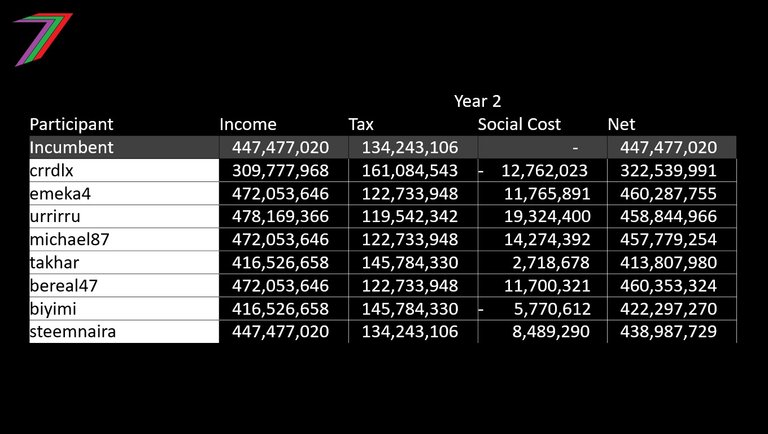
Table 5: Income and Social Costs Year 3, totals and contest winner
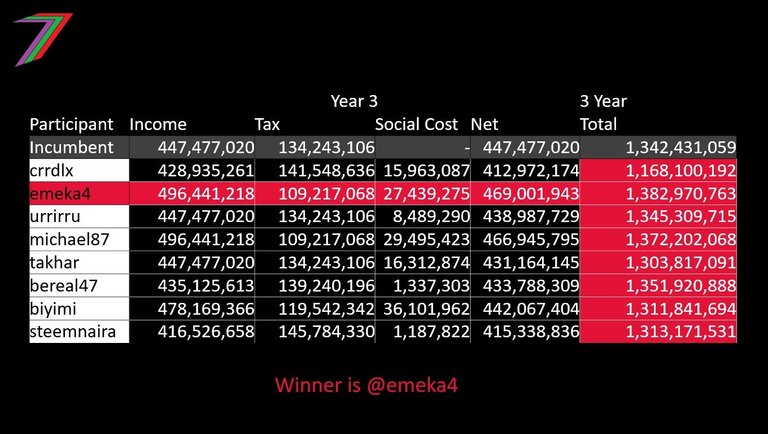
Congratulations to @emeka4 for winning the Tax Game Contest with an income net social cost of $1,382,970,763. @emeka4 wins 30 Hive Power.
Contest Tips and Analysis
It is difficult to determine the optimal tax rates to use. Participants could enter the formulae given into a spreadsheet to gauge the values that are likely to give better results. This would be a time consuming exercise and it is possible something could go wrong entering the formulae, variables and parameters. Studying the figures provided in the question is an easier alternative approach.
The current tax rate of 30% is a little high. It is stunting economic activity. Lowering the tax rate is the first logical approach. Lowering straight to a more desirable level (e.g. around 20%) will create an immediate social cost as tax revenue would fall quite sharply. Lowering tax revenue more gradually would be a better strategy. @emeka4 and @michael87 adopted this strategy. @emeka4 choose lower tax rates than @michael87. This achieved a better outcome. @emeka4 was very close to determining the optimal combination of tax rates for this contest. A different combination of parameters could have changed the outcome of this contest. That is the element of luck.
Some participants choose to lower and then raise tax rates or vice versa. This strategy creates a double penalty. There is a social cost of reducing services and reduced benefits from increasing revenue for new initiatives. Participants need to decide on a tax rate they want to target and then work towards it.
More posts

I have several collection of posts. I have organised these collections based on content and purpose.
The first collection contains six collection posts created before PeakD had the collection feature. Four of these posts relate to the core of my content, one of them contains all my Actifit Posts, and one of them contains my video course ‘Economics is Everyone’.

The second collection consists of the posts that I consider define my channel. These posts are significant in terms of content as well as how they contribute to the growth of the channel. These posts reveal the most about what I believe in.

The third and fourth collection is what I call my ‘Freedom-base Economics living book’. They contain all the posts that support my ideas about the value and power of freedom. Some of these posts explain what we can achieve with freedom and what we need to utilise it. Some of them explain how we are deprived of freedom and how we often give up freedom for security and comfort. The third collection concludes with possible scenarios depending on what we (society) choose to do.


Hive: Future of Social Media

Spectrumecons on the Hive blockchain

▶️ 3Speak
Wow am so excited about this and thanks for organizing the contest.
No problem, you did a great job. I plan to pay out your winnings on October Hive Power Up Day.
No problem and thanks a lot.
Very good contest. Best of luck to participants.
A big congratulation to the winner